Insight M's Veritas-aligned methane intensity methodology

Version 1.4, October 11, 2024
1. Introduction
Veritas is a methane emission measurement and verification initiative led by GTI Energy (veritas.gti.energy). Its protocols for the upstream sector, referred to here as the Veritas protocols, provide an industry-standard methodology for calculating a measurement-informed methane intensity for oil and gas operators (GTI Energy, 2023a,b,c). Calculating methane intensity based on empirical data quantifies true operator performance, helping operators minimize product loss and reduce environmental impact. This measurement-informed approach can be contrasted with approaches based on equipment counts and expected emissions factors per piece of equipment (e.g. inventory methods). A key feature of measurement-informed approaches is that they allow understanding of super emitter sources, which are rare but consequential events resulting in large-scale methane loss. They also allow operators to evaluate the direct impacts of improved operator work practices on methane emissions over time. Because of this, the Veritas protocols provide a robust methodology for assessing individual operators while also facilitating direct comparisons between operators within a basin.
This document outlines the Insight M implementation of the Veritas protocols, based on basin-wide surveys of upstream (production) emission sources conducted by Insight M using its proprietary LeakSurveyor™ technology. Insight M helps operators take a pragmatic approach to reduce their methane emissions by providing emissions solutions that maximize profits and generate proof of methane performance.. The implementation described here is based on reconciled basin-scale models of site-level emissions generated by researchers at Stanford University (Sherwin et al., 2024) as well as direct measurements of upstream (production) emission sources, collected by Insight M across oil and gas basins in the United States. Each detected methane emission source is associated with a quantified emission rate, observation timestamp, source type, and anonymized asset ownership (where available). By processing these unique data sources with the open-source Veritas protocols, Insight M generates scalable, data-driven methane emission inventories to help the oil and gas industry adopt the most successful methane mitigation practices.
2. Glossary
Analysis period: Period of time during which an operator’s methane emissions intensity is calculated. The Veritas protocol is written assuming an annual period, while the implementation provided here allows for a flexible definition, including annual or sub-annual periods, when adequate data are available. The analysis period is defined with a start date and an end date, inclusive. Currently, one calendar month is the minimum possible period, based on available basin-wide production data.
Asset: Part of the gas system owned by a natural gas company, comprising of multiple devices that allows the company to produce, process, transport, store, and/or distribute gas.
Coverage event: Event during which an asset is surveyed. A coverage event may consist of multiple surveys if they occur within the coverage window.
Coverage window: Short period of time defining the coverage event for an emission source. If multiple observations (surveys) occur within the coverage window, the emission source rate for the coverage event is quantified as the average of all observed emission rates within the coverage window, including non-detections (where rate = 0 kg/h), and the coverage event timestamp is set to that of the first observation. The coverage window used in this implementation is equal to three days.
Emission: Describes a release of gas from intentional or unintentional operational and maintenance activities, such as equipment blowdowns and equipment breakage.
Emission source: A location where actively emitting methane is detected, which may be associated with a specific piece of equipment at an upstream asset.
Emission source timeline: A sequence of observations of a given emission source, where each observation is a survey (or individual observation) with a timestamp, observation outcome (detect/non-detect), and quantified emission rate (rate = 0 kg/h if the observation is a nondetection).
Emission source time period: The time period encompassing an estimated start and end date of an emission source. The full emission source time period is equal to the estimated duration of the emission.
3. Summary Overview of the Insight M Implementation
The Insight M implementation of the Veritas protocols aims to generate operator-specific emissions intensities for a time period of interest from large scale methane emissions surveys. The Insight M implementation follows Veritas protocol guidance to use the Natural Gas Sustainability Initiative (NGSI) Methane Emissions Intensity Protocol.
Methane emissions intensity (abbreviated “MI” in the equation below) is equal to the total methane emissions from a natural gas system divided by the methane content of natural gas throughput. The methane emissions intensity equation described by NGSI, (2021) and GTI Energy (2023c) is modified to use gas volume units of thousand cubic feet (MCF), yielding:

Where
And
- Egas is equal to the energy content of methane produced by the operator at sites covered by our survey, using a conversion factor of 1.235 MMbtu/MCF.
- Eoil is equal to the energy content of oil produced by the operator at sites covered by our survey, using a conversion factor of 5.8 MMBtu/barrel.
There are two key inputs for this calculation: Total emissions (numerator) and total production (denominator). To generate an estimate of total emissions for a given operator and time period, Insight M implements the Veritas Source-Based Reconciliation Pathway. This is a combined approach that merges top-down measurements with bottom-up inventories to generate an estimate of emissions across all possible emission rates. This approach is ideal, as it captures both process-based emissions (more easily modeled) that occur below the sensitivity of the sensor used to generate the top-down dataset, and larger emissions (more easily measured) caused by both equipment failure and routine operations that may vary considerably across operators as well as sites. This implementation is broadly applicable to datasets collected by different sensors with varying sensitivity. At higher sensitivities, larger fractions of emissions are directly measured, and a smaller fraction modeled. In some cases, Insight M may instead implement the Veritas Measurement-Only Reconciliation Pathway when the sensor sensitivity is sufficient to detect ≥90% of emissions in a given oil and gas basin.
Natural gas throughput (total production) is scaled by the NGSI-specified default methane content of 83.3%, which meets the Veritas divisor criteria of being equitable across all operators and is well-documented by NGSI (Natural Gas Sustainability Initiative, 2021). As data improve, replacing this single value with a basin-specific value will improve accuracy in the loss rate calculation. Third party data is used to generate an estimate of total production for a given operator. Production data are filtered to include only the assets of specific areas and time periods of interest.
The following section (Section 4) begins with a summary of Insight M data collection and processing, including discussion of alignment with the Veritas Measurement Protocol: Production Segment, Version 1.0. Next, the full implementation is described following the prescribed form outlined by the Veritas Reconciliation Protocol: Production Segment, Version 1.0:
- Choose reconciliation pathway
- Perform cause analysis
- Analyze measurement results
- Reconcile inventories
- Application of test
- Final results and reporting
Note that the Veritas protocols were designed to be used by individual oil and gas operators. It occasionally requires data that are not available to third-parties, such as Insight M, or suggests methods that are not applicable to basin-scale implementation. The approach outlined here makes every effort to stay within the broader goals, guidelines, and spirit of the Veritas protocols. Areas where strict adherence is not possible are detailed throughout this document and summarized in Section 6. Section 7 further describes expected areas of future development that will allow closer alignment with the protocols as written.
4. Implementation
4.0. Insight M data collection and post-processing
Insight M operates the LeakSurveyor system, a light-aircraft mounted methane gas imaging system capable of detecting medium to super emitter methane emissions. Currently, Insight M deploys the LeakSurveyor with adjustable target sensitivity ranging from 10 to 100 kg/hr at 3 m/s wind with a 90% probability of detection.Detailed system information is provided by Berman et al. (2021). At a high level, the system consists of three integrated measurement devices: (1) an infrared spectrometer calibrated to detect methane; (2) global positioning system (GPS) and inertial measurement unit (IMU) to record precise position; and (3) a high-resolution optical camera for visual verification of sites. While LeakSurveyor is capable of surveying at a range of sensitivities, the implementation described here relies on emissions surveys collected at consistent instrument sensitivities. Integration of surveys collected by different providers and at different sensitivities is planned for future development (discussed further in Section 7).
Once collected, data are processed automatically via the Insight M proprietary data analytics pipeline, which converts raw spectral data into detected methane plumes. Emission rates are quantified for each plume detection in wind-independent units, and converted to units of methane gas flow using wind speeds for the site and time of each observation. Insight M sources wind speed estimates from publicly available weather reanalysis products, such as MeteoBlue or the National Oceanic & Atmospheric Administration High-Resolution Rapid Refresh (HRRR) model. Each emission measurement is equivalent to a “snapshot” measurement collected over a short period of time. For more detailed information on Insight M quantification methodology see Insight M (2024).
Plume detections are enhanced with additional metadata. Where any individual flyover produces a single measurement of a site, multiple flyovers can detect an emitting source multiple times, generating multiple plume images. These images are grouped together into an “emission source.” Each emission source is labeled with the type of oil and gas asset from which it is emitting. In this methodology, only emissions associated with upstream assets are used. Asset data are currently acquired from Enverus DrillingInfo.
Thus, every emission source developed by Insight M has the following information associated with it:
- Location (latitude and longitude)
- Timeline of observations, where each observation consists of a coverage timestamp, coverage sensitivity, and the detected rate at that timestamp; timelines include coverages with a rate of 0 kg/h for a non-detection at the emission source location.
- Asset type & industry segment
- Anonymized operator ID
- Reported status, indicating whether or not the observation was reported to the operator by Insight M.
4.0.1. Alignment with the Veritas Measurement Protocol
The Veritas Measurement Protocol provides a pathway for both categorizing and measuring emissions. Insight M follows this protocol by categorizing emission types into two buckets, “best calculated” and “best measured,” based on the sensitivity of the instrument used for top-down measurement (in this case, the Insight M LeakSurvyor). All detected emissions are categorized as “best measured,” while smaller emissions below the LeakSurveyor deployed sensitivity are categorized as “best calculated.” The present implementation incorporates LeakSurveyor deployed sensitivities of 10 and 25 kg/hr. Modeling of “best calculated” emissions relies on basin-specific, bottom-up emissions inventories, sourced from Sherwin et al., (2024), and is described further in Section 4.4.
The Veritas protocols require that all operator sites be surveyed in order to calculate methane emissions intensity. In this implementation, a minimum coverage threshold is used to ensure that measurements capture a representative sample of each operator included in the analysis. Guidelines set out by Sherwin et al., (2024) are modified to align with the spirit of the Veritas protocol requirement of robust coverage. Sherwin et al., (2024) define “comprehensive” coverage of oil and gas basins as including at least 50% of well sites and 80% of total natural gas production in a given region. In the current implementation, the latter threshold is modified to be defined as 70% of an operator’s total oil and gas production in barrels of oil equivalent (BOE). As this implementation uses both oil and gas production in calculating methane emissions intensity, a BOE based inclusion criteria yields a more accurate estimate of methane emissions intensity than a criterion relying solely on gas production. This completeness threshold is applied at the operator scale, and operators with coverage below this threshold are excluded from analysis. Please see Section 7 for additional discussion of how coverage thresholds may be modified in subsequent iterations of this implementation.
The Veritas protocols assume production data to be readily available, which is reasonable for an operator but less so for a third party such as Insight M. Therefore, an additional data quality criterion is included to ensure that sourced production data for an operator is sufficiently comprehensive and representative. The current implementation requires ≥90% of an operator’s assets included in the survey area to have available production data for the analysis period. If available production data for an operator does not meet these criteria, the operator will be excluded from analysis.
4.1. Choose reconciliation pathway
This implementation, as described above, opts for the “Source-Based Reconciliation Pathway,” which combines top-down measurements with bottom-up modeling (see pg. 13 of Veritas Measurement Protocol version 1.0). This approach is appropriate for Insight M basin-scale datasets, which are currently most frequently collected at a sensitivity of 25 kg/h. Future iterations of this methodology may implement the “Measurement Only Reconciliation Pathway,” when higher sensitivity data is available. For example, in some basins, a basin-wide sensitivity of 10 kg/hr may be sufficient to meet the Veritas threshold of being able to measure more than 90% of emissions (see Sherwin et al., 2024). Any future implementation will follow Veritas guidance in determining the appropriate reconciliation pathway by comparing sensor sensitivity for input datasets to the latest basin-wide methane emissions distributions, such as Sherwin et al., (2024) or Cusworth et al., (2022).
4.2. Perform cause analysis
In this step, Veritas recommends performing source attribution, determining the cause of the emission, and categorizing a source as either “best measured” or “best calculated” (see pg.14 of Veritas Measurement Protocol version 1.0). Note that at this stage, Insight M detections have already been assigned a source attribution as part of the initial data processing (described above). However, determining the root cause is not possible for Insight M to do as a third party without operator-provided information. Subsequently, using the root cause analysis to partition an emission into “best measured” or “best calculated” is similarly infeasible.
As described in Section 4.0.1, all detected sources are categorized as “best measured,” which is consistent with the Veritas protocol guidance that any measured source with unknown or indeterminate cause should default to this category. Additionally, Veritas notes that root cause analysis is critical for determining whether site-level emissions are emitting from one or multiple emission sources on a pad. In the case of Insight M datasets, the spatial resolution of both the optical imagery as well as methane measurements collected by LeakSurveyor is adequate to attribute emissions to specific pieces of equipment and therefore yields a significant number of examples in which individual sources, including their rates and estimated duration, are analyzed separately before being aggregated to the site level (described in greater detail below).
4.3. Analyze measurement results
In this step, Insight M conducts initial vetting of the top-down results (emission sources) and calculates a measurement-based emission rate, duration, and volume for each site. The Veritas protocol notes that vetting measurements may include removing or modifying data, based on information available about activities, ground conditions, or if a source has been misattributed to the wrong operator. In the current implementation, Insight M does not remove or modify emission sources. In future iterations of this methodology some data may be modified following Veritas-provided examples. For example, if a source is reported by an operator as emitting from an asset that does not belong to them, its attribution may be updated (see Section 7 for additional details).
4.3.1. Quantifying site-level emissions
Once methane emission measurements have been validated for a specific emission source, a rate measurement value and associated confidence bound for the data analysis period are calculated. At this stage every plume observation associated with an emission source has a quantified rate and a known measurement uncertainty based on extensive internal and single-blind controlled release testing of LeakSurveyor instruments (Sherwin et al., 2021; El Abbadi et al., 2024).
The current methodology reflects considerations specific to Insight M data collection (and may be updated to include datasets collected by additional providers if these become available). Insight M implements a sampling strategy that is informed by multiple priorities, including customer obligations and airport proximity, and adopts a “measure everything” approach. Given a specific analysis period, such as a year or 6 months, there can be anywhere from one to multiple fly-over surveys of different sites in a basin of interest. At the basin-scale, this strategy produces uneven sampling across operators and sites, in terms of both the number of observations as well as the regularity of their collection for a given location. While Insight M can quantify an emission rate with each plume observation (within some error), assessments of potentially varying rates over time as well as source duration estimates will be affected by this sampling.
Survey frequency variability requires centering any assumptions of duration at the source level, by incorporating information across surveys to constrain duration based on the best information available. This implementation therefore modifies the Veritas-recommended approach to estimating emission source rate and duration (based on an average of rates over the complete analysis period), and instead defines source durations and emission rates based on emission source timelines.
In its simplest form, the duration of an emission source will be defined by its sequence of observations in the emission source timeline. Each observation consists of a coverage timestamp, coverage sensitivity, and detected rate at that timestamp, including a rate of 0 kg/h for a non-detection. In a sequence of surveys, an emission source may be observed to go from a non-emitting to emitting to non-emitting state. The duration of that source is therefore estimated to persist from halfway between the first and second survey until halfway between the second and third survey. If an emission source is observed across sequential surveys, it is assumed to persist for the full time period between those surveys. Thus, instead of averaging all detected and non-detected (rate = 0 kg/h) rates and persisting an emission across the full analysis period (as recommended by Veritas), the detected rate is modeled to persist for a shorter, empirically informed duration. Insight M sometimes covers emission sources at different sensitivities in subsequent surveys. If Insight M surveys an asset at 10 kg/h sensitivity and detects an emission that is <25 kg/h, the end date for that emission will not be set until there is a non-detect at a 10 kg/h survey or the analysis period ends. In other words, a subsequent coverage during a 25 kg/h survey will either detect the emission (indicating persistence) or not detect the emission, but in the latter case this non-detection will not count as a non-detect for purposes of constraining the emission’s duration. In all other cases (ie. detections first detected at a 25 kg/h survey, or detections greater than 25 kg/h), the standard methodology applies.
While this simple example is representative of the overall approach, modifications are required to handle cases where detections occur in either the first or last survey of an analysis period. Note that emission source timelines may exist independently of a given analysis period, and could include observations before or after the analysis period. When considering discrete analysis periods, such as in the included case study of the Permian Basin (see Section 4.6) or when analyzing an area with no previous data available, only observations that occur within the analysis period are considered. This is a simplifying assumption which constrains emission source timelines to the selected analysis period. In these cases, the start date of an emission is set to halfway between the start of the analysis period and the first survey. This is different from analyses that may incorporate multiple analysis periods, such as when calculating quarterly or monthly methane intensities within a given year. See Section 4.3.2 below, detailing the approach for apportioning emissions across analysis periods for sequential analysis periods.
Modeling emission end dates includes an additional dependency that considers the reporting state of an emission. Many data providers, including Insight M, report emissions based on existing customer obligations. Therefore, if an emission is reported to an operator, an assumed end date defaults to one week after the date of the report. This may be adjusted if more specific information on the end date of an emission is available. In all cases, should a source be detected in subsequent surveys, any modeled emission end date will be overridden and the source assumed to persist between both surveys where it was detected. In the case of an unreported emission, Insight M will assume that its duration persists until halfway between a survey where it is detected and a survey where it is not, as described in the above base case. Thus, even in absence of reporting, emission durations are constrained based on observations. In the included case study, an emission observed in the final survey of an analysis period is assumed to persist until the end date of the analysis period.
Next, the average emission rate for each emission source time period (or estimated duration of the emission source) is calculated. Because multiple fly-over inspections of a site may have been conducted within a brief period of time (in some cases as high as 20 to 30 depending on a number of factors, including airport proximity), contiguous surveys are first temporally aggregated by applying a three day coverage window to the emission source timeline. All observations of an emission source within the coverage window are aggregated into a single coverage event by averaging the emission rates, including rates of 0 kg/h for non-detections.
This aggregation of individual observations into coverage events is specifically designed to address uneven sampling, and yield reliable emission rates during long periods without observations. With an uneven sampling approach, clusters of many, frequent observations could be separated by one or more months with no survey. If one were to take a simple timeline approach, the emission rates inferred to have persisted between observation clusters would be based solely on the most proximal emission rate measurements (i.e. the last observation in the cluster, and the first observation in the subsequent cluster). Consequently, the methane intensity measurement of a given operator would be heavily weighted by these individual measurements. Instead, aggregating emission rates and non-detections within the coverage window into a single coverage event accounts for both emission rate variability and lower emissions overall due to source intermittency. These aggregated emission rates are therefore more representative of the long term behavior of a given emission source between observation clusters, and consequently the average emission rate during the analysis period.
Finally, the total emission volume for each emission source is calculated by averaging the emission rates from each coverage event during the emission source time period and multiplying it by the estimated emission source duration. The total emission volume is summed for all individual emission sources at a site to yield a site-specific emission volume for the analysis period. As part of this process, error is quantified and propagated to define a confidence interval for total emission volume at each site. These errors are further propagated to operator methane emissions intensity estimates. Additional error resulting from simulated emissions is accounted for, as described below. The complete error propagation pathway is summarized in Section 5.
4.3.2. Apportioning site-level emissions across sequential analysis periods
Emission source timelines may start in one analysis period but end in another. In such a case, the emission volume from a single emission source is apportioned into each relevant analysis period according to the number of days the emission was modeled to occur in each analysis period. For example, if a site is surveyed once in “Analysis Period 1” with no detection, and once again in “Analysis Period 2” with a detected emission source, the modeled emission start date (i.e., the mid-point between the two site survey dates) may occur in “Analysis Period 1.” In this case, even though the emission source was first detected in “Analysis Period 2,” part of its total emission volume (calculated as its rate multiplied by the number of days modeled to occur in “Analysis Period 1”) will be assigned to “Analysis Period 1,” and not to “Analysis Period 2.” If the modeled start date for the emission source falls into “Analysis Period 2,” then no emission volume will be apportioned to the previous analysis period. This same apportionment approach is taken for emissions that are detected in one analysis period but modeled to end in the subsequent analysis period.
4.4. Reconcile inventories
Veritas provides guidance for generating a reconciled, “measurement-informed inventory” of emissions by combining top-down and bottom-up estimates (see pg. 18 of Veritas Measurement Protocol version 1.0). This implementation uses bottom-up emission source distributions to quantify an emission rate for methane sources below the detection limit of the sensor that generated the top-down dataset. Bottom-up distributions are sourced from Sherwin et al., (2024), who use the Rutherford et al., (2021) model to construct basin-specific emission distributions based on updated equipment and facility counts. This model updates component-level emission factors used in the EPA greenhouse gas inventory (GHGI) with the latest scientific findings, and combines them with a novel bootstrapping approach that allows it to model larger emitters than found in the GHGI. The distribution is truncated at the highest sensitivity of the sensor deployed at each asset, based on the assumption that any emissions larger than this threshold would be observed by the top-down survey. For example, if an asset had been surveyed with both 10 and 25 kg/hr sensitivity deployments, the emission distribution would be truncated at 10 kg/hr, while if an asset was only surveyed with 25 kg/hr sensitivity deployments the emission distribution would be truncated at 25 kg/hr. An emission rate is sampled from this distribution for each unique asset covered during the analysis period to generate a complete estimate of emission rates below the detection sensitivity of the deployed sensor.
The complete, reconciled methane emissions intensity estimate is generated using a Monte Carlo simulation for a given operator in a given basin and analysis period, based on site-level measured and bottom-up estimates of methane emissions. The general reconciliation procedure for each iteration is as follows:
- Sum the total measured emission volume derived from observed emission sources and their estimated duration, as described above.
- Simulate an emission rate below the sensitivity of the deployed sensor for every upstream site surveyed, by randomly sampling (with substitution) from the truncated basin specific bottom-up emission distribution.
- When data on the average duration of emissions below the sensitivity of the deployed sensor is unavailable, multiply simulated emission rates by half of the length of the analysis period to obtain a volume. For example, a full year analysis period will use a 182.5 day duration.
- When applicable, this modeled duration is adjusted to account for known regulatory impacts. For example, an assumed half-year duration for sub-MDL emissions in a basin in the United States will be adjusted by the fraction of wells known to be subject to OOOOa. These wells are modeled to have a duration of one quarter of a year due to their mandated biannual inspections. The weighted average duration calculated across these two groups is assigned to all sites as the emission duration for sub-MDL emissions for a given basin and analysis period.
- Sum together the total measured and total simulated emission volumes, and multiply by the operator’s gas ratio.
- Divide by the total methane production of the operator’s covered assets over the analysis period assuming the NGSI-specified methane content of 83.3%.
A total of 106 iterations of the above procedure are performed to yield consistent results. A sensitivity test verified that this number of iterations yields less than 1% difference between individual runs of the simulation, indicating this is a sufficient number of iterations. The Monte Carlo simulation yields a distribution of methane emissions intensity for the operator. Insight M reports the median methane emissions intensity, and associated one sigma uncertainty of this methane emissions intensity distribution. See further discussion of uncertainty propagation in Section 5.
4.4.1. Final data quality check for basin-wide analyses
As a final check, the operators included in the basin-wide assessment are assessed using a series of data quality filters in order to ensure that resulting methane emissions intensity values included are sufficiently representative of a company’s operations in the basin and time period of interest (Table 1). Primarily, this results in excluding operators due to insufficient survey coverage or production data. This filtering is done in the following steps, but is not required to occur in this order to yield identical results:
- Remove any operator with zero methane production in all assets surveyed. Since covered methane production is in the denominator of the methane emissions intensity calculation, a methane emissions intensity cannot be calculated when an operator has zero methane production.
- Remove any operators with less than 50% of assets and 70% of oil and gas production (BOE) surveyed. This ensures sufficient coverage to yield a representative sample of an operator’s emissions and an accurate methane emissions intensity (see Section 4.0.1 for discussion).
- Remove any operator for whom less than 90% of surveyed wells have production data. This eliminates cases where missing production data results in anomalously high methane intensities.
- Remove any operator that has no measured emissions and does not meet a minimum site visit threshold. This site visit threshold is calculated as the average number of site visits in the basin analysis per number of observed emissions in the analysis (i.e., the number of site visits required to detect a single emission). For example, in the Permian 2022 case study, Insight M filtered out operators with no measured emissions and fewer than 250 site total site visits. We implement this filter because it cannot be confidently concluded that an operator should not have any emissions above the LeakSurveyor deployed sensitivity if Insight M has not met this minimum site visit requirement over the operator’s sites. This threshold is adjusted for other basins or analysis periods based on the respective rate of observed emissions per site visit.
- Remove operators with less than 2000 BOE/day of production, due to the strong inverse correlation between production rate and methane emissions intensity, where low producing wells and operators generally have the highest methane emissions intensity (Omara et al., 2018; Rutherford et al., 2021; Figures 1 & 2). Note that for a basin-wide operator comparison, such as the case study presented below, applying this threshold does not typically change the rankings of individual operators, but it does remove the smallest producing and lowest ranking operators.
Table 1. Filtering thresholds used in this methodology.
| Filter | Threshold |
| Covered Methane Production | >0 |
| Production Coverage Completeness | >50% of assets and >70% of oil and gas production (BOE) |
| Percent of Wells with Production Values | >90% |
| Site Visits | if no measured emissions, > the 250 average site visits/observed emissions for this analysis |
| Production Rate | >2000 BOE/day |
4.5. Application of test
Veritas recommends assessing the resulting “measurement-informed inventory” to determine if measurement objectives have been achieved. The recommended test is to evaluate whether 50% or more of a site’s methane emissions estimate is derived from measurements. However, as noted in the Veritas protocol, “Veritas allows an exception to the reconciliation test in cases where a top-down or whole site technology has been deployed that is the best available and/or lowest MDL technology. In this case, most of the measurement informed inventory need not be from direct measurement” (see pg. 21 of Veritas Measurement Protocol version 1.0). This implementation considers the Insight M LeakSurveyor as among the best-available, lowest-MDL technologies capable of conducting basin-wide surveys within a reasonable analysis period (a month to a year). Therefore, this exception applies and the measurement objectives are achieved, even for operators for which no emission sources were detected.
Table 2. Impact of filtering operations on the number of operators remaining in the analysis at each filtering step of the Permian Basin case study.
| Filter | Threshold | Number of Operators Remaining |
| Initial Number of Operators | - | 1221 |
| Covered Methane Production | >0 | 622 |
| Production Coverage Completeness | >50% of assets and >70% of oil and gas production (BOE) | 439 |
| Percent of Wells with Production Values | >90% | 429 |
| Site Visits | >250 site visits if no measured emissions | 195 |
| Production Rate | >2000 BOE/day | 72 |
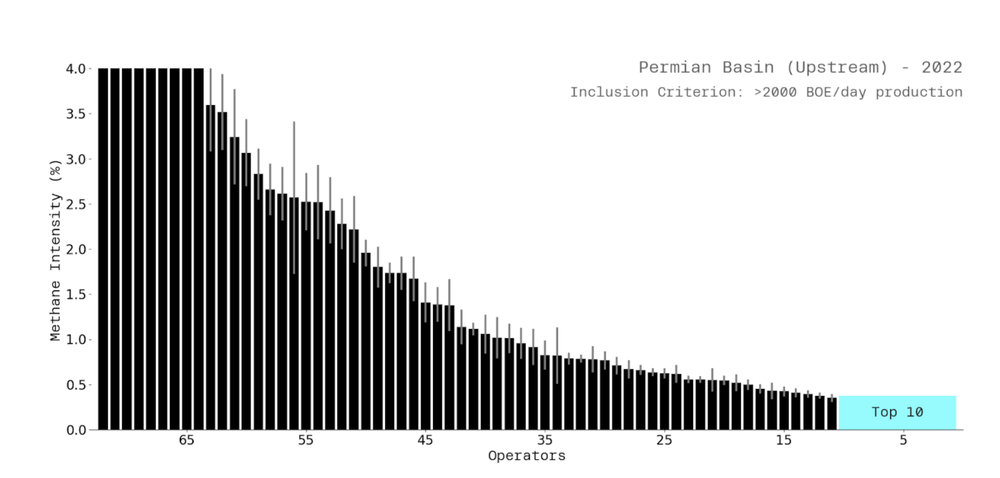
Figure 1. Permian Basin methane intensity ranking of operators with >2000 BOE/day production.
4.6. Final results and reporting
Veritas emphasizes the importance of recording and reporting final results, their confidence bounds, techniques used, and adjustments made to the data. This is demonstrated here in the form of a case study illustrating a basin-wide application of the Veritas protocol, as described above, to the Permian Basin for the analysis period of January 1st, 2022 to December 31st, 2022. This case study solely includes 25 kg/hr sensitivity LeakSurveyor deployments. The basin-wide survey covered approximately 20,000 square miles. Survey operations included over 660,000 inspections of over 140,000 unique sites owned by over 1,032 operators. The survey detected more than 6,000 individual emissions.
Due to the one year analysis period, a half year emission duration is applied for sub-MDL modeled emissions. This is further reduced to 162 days, which is a weighted average duration that accounts for the 22.8% of active wells determined to be subject to biannual OGI screening under EPA’s OOOOa regulation.
Table 2 describes the number of operators remaining in each step of the final quality control check. The remaining operators make up 85% of the 2022 production volume for the covered portion of the Permian Basin. Figure 11 shows the final methane intensities and associated uncertainties sorted from largest to smallest, above the 2000 BOE/day production threshold. The maximum methane emissions intensity calculated for an operator is 8.9%.
5. Error Propagation Pathway
Veritas requires quantifying uncertainty. The above implementation incorporates and propagates error through every step of measurement, data analysis, and modeling. This pathway is summarized below.
5.1. Uncertainty on Measured Emission Rates
Sensor uncertainty must be quantified. In this case, Insight M assesses quantification accuracy as well as probability of detection of LeakSurveyor instruments through controlled release testing, where methane gas is released at a known rate and is measured by the instrument (see Sherwin et al., (2021) for one example of peer-reviewed, single-blind testing of LeakSurveyor). These controlled releases demonstrate a relationship between controlled and estimated emission rates, which allows calculation of a quantification error (Insight M, 2024). A one sigma error of 40% is applied to each measured emission, as derived by Sherwin et al., (2021) from single-blind controlled release testing where the error on measured emission rates was found to follow a normal distribution. The 40% error incorporates uncertainties related to both instrument performance, and wind reanalysis. In practice, this means that measured emissions rates are inferred to be within 40% of the true emission rate 68% of the time. While error in underlying wind-wind reanalysis data may vary regionally (e.g. Fovell and Gallagher, 2022) the uncertainty included herein is assumed to be sufficiently large to account for this variability. These uncertainties are then propagated through any averaging and summation used to estimate the total emission rates of a given emission source.
5.2. Uncertainty Associated with Emission Duration
Duration uncertainty for a given emission source time period is constrained by its emission source timeline. Given a start and end date of the emission source time period (defining the estimated emission source duration):
- Start date error is calculated as one third of the duration between the start date of the emission source time period and the first detection.
- End date error is set as one third of the time period from the last detection and the termination of the emission. The termination of the emission can be equal to the end of the analysis period, the first survey without a detection, or at the end of the one week “repair period” following the date of a reported emission.
- The errors on the start and end of the emission source time period are then summed to yield a total uncertainty on the emission duration of the emission source time period.
Total uncertainties on emission duration are assumed to represent one standard deviation of a Gaussian distribution when propagating error through the methane intensity calculation.
5.3. Uncertainty in the Methane Intensity
Errors for methane intensity are estimated by propagating them through the Monte Carlo simulation. Errors are both input and reported at the one sigma level, or one standard deviation.
- First, apply a random Gaussian error to the total annualized emission volume of the operator, sourced from error propagation of uncertainties related to the observed size of emissions from controlled release data (5.1) and emission duration (5.2). These errors are assumed to be uncorrelated.
- Next, estimate the uncertainties associated with simulated emissions via random sampling of the basin-specific truncated emission distribution and iteration through the Monte Carlo Model. An additional one sigma Gaussian uncertainty of 10% is assumed on the total modeled emissions rate to account for any inconsistencies in the model, due to the operator having different equipment than the basin average, or production changes within the oil and gas basin since the model was originally generated.
- Finally, generate a distribution of methane intensities as outlined above, and report the one sigma uncertainty on the median value.
Collectively, this pathway incorporates uncertainty related to measurement quantification, emissions occurring below the sensitivity of the sensor, and emission duration and intermittency (see additional discussion of intermittency in Section 7.3).
6. Summary of Adjustments for Basin-Scale Application
Deviation from the Veritas protocols described herein typically occurs when Insight M does not have data that would otherwise be available to an operator. On the other hand, Insight M strives to improve the methane intensity calculation using basin-wide data that may not be available to an operator. The key deviations from the Veritas protocols are summarized below:
0. Data collection and post-processing
- Veritas requires complete coverage of an operator’s assets to calculate methane intensity. This implementation modifies the completeness criteria outlined in Sherwin et al., (2024) to include only operators with at least 50% of assets and 70% of BOE of production covered during the analysis period. Operators are also removed if third party production data is not available for 90% or more of assets covered, to ensure that results are representative of the operator’s overall production.
1. Choose reconciliation pathway
- This implementation does not deviate from the Veritas protocols in this step.
2. Perform cause analysis
- Root cause analysis, as required by the Veritas Reconciliation Protocol, is not performed due to lack of available data and site access.
3. Analyze measurement results
- The Veritas-recommended approach to estimating emission source rate and duration is enhanced by defining these based on source-specific emission source timelines.
- In place of an annualized emission rate, the total volume of emissions over the analysis period is instead calculated to increase the flexibility of this methodology.
4. Reconcile inventories
- The Veritas protocols’ suggestion to apply a methane content value derived from site-level gas sampling cannot be implemented with available data. Instead, the NGSI default average methane content of 83.3% is used, which meets the Veritas divisor criteria of being equitable between operators and well-specified and documented by NGSI.
5. Application of test
- This implementation does not deviate from the Veritas protocols in this step.
6. Final results and reporting
- When calculating methane intensity, uncertainties in measured and simulated emissions are calculated, as an improvement upon the current iteration of the Veritas protocols.
- In place of a final report given to a specific operator, a complete, basin-wide benchmark of operator performance is produced (as illustrated in the included 2022 case study). This method can also be used to assess performance on behalf of a specific operator.
7. Areas for Further Development
7.1. Variable sensitivity from different data providers
Incorporating data collected by different sensors will reduce uncertainty and enhance the final methane intensity estimate. Integration of datasets provided by multiple data providers will be implemented as soon as such data becomes available. Insight M will develop a methodology for aggregating this emissions data as part of ongoing development of its Veritas protocol implementation. As higher sensitivity products are integrated, the threshold where the method switches from measured to modeled will shift downward and the resulting estimate will be based on a higher fraction of measured emissions, as we have implemented for variable sensitivity products offered by Insight M.
7.2. Duration and intermittency
Temporal uncertainty is a significant challenge. Recently passed regulatory requirements expected to come into effect in 2025 could drive operators in the United States to adopt aerial survey frequencies of up to twelve times per year, which will allow more rigorous estimates of emission source durations based on airborne data. In the meantime, assessing source persistence across more frequent surveys, made possible by the growing network of Insight M participating operators, will help accomplish the following:
- Refine estimates of emission duration for sources detected during the first and/or last coverage event of the analysis period, by developing models of emission duration based on basin-wide datasets such as that analyzed in the provided case study.
- Refine the current assumptions on duration and emission sources not reported to operators, potentially by building models of emission source duration based on basin-wide datasets.
- Better account for intermittent emission sources and improve duration estimates for this class of emissions.
- Develop generalized repair time estimates for basins and segments based on operator- or expert-provided information.
- Refine emission duration estimates of very small emissions, based on site-specific regulatory LDAR requirements for surveyed assets that would normally be carried out by an operator.
7.3. Bottom-up emissions distributions
Insight M can improve estimates of simulated emissions below the sensitivity of a deployed, top-down sensor by using more up to date, and more granular, emission distributions:
- The Sherwin et al., (2024) bottom-up emissions inventories (based on the Rutherford model) rely on equipment and production data from 2018 – 2021. Using new bottom-up estimates that are derived for the same time period as the aerial survey can improve the overall accuracy of these methane intensity estimates.
- The Veritas protocols encourage using local, equipment-specific emissions distributions. However, such datasets do not yet exist at the scale required for basin-wide (or multi-basin) analysis. In future implementations, such distributions will be used as they become available. As part of this, sensitivity testing will be conducted to assess the impact of different emission distributions on estimated emissions that occur below the detection sensitivity of the deployed sensor.
7.4 Inclusion criteria
As Insight M increases coverage of oil and gas basins, inclusion criteria for oil and gas operators will be strengthened. Ultimately, the target for these criteria will be compliance with any specific guidance for basin-wide surveys included in future versions of the Veritas protocols. As a shorter term goal, increasing the BOE coverage requirement from 70% to 80% will align this methodology with the recommendation of Sherwin et al., (2024). As part of this, sensitivity analyses will be conducted to assess the impact of selected inclusion criteria on basin-wide assessments. Furthermore, additional issues surrounding third party site-level production data will be explored with the goal of reducing this source of error.
7.5 Reporting of uncertainty
Future implementations will explore quantifying methane intensity and associated error through other metrics, such as the Swanson’s mean, reporting errors, and asymmetric confidence intervals, in order to find the most accurate and meaningful method to report results.
8. References
Berman, E.S.F., Wetherley, E.B., Jones, B.B., 2021, Methane Detection (white paper), Revision 1F https://kairosaerospace.com/wp-content/uploads/2021/01/Kairos-Aerospace-Methane-Detection.pdf
Chen, Y., Sherwin, E.D., Berman, E.S.F., Jones, B.B., Gordon, M.P., Wetherley, E.B., Kort, E.A., Brandt, A.R., 2022. Quantifying Regional Methane Emissions in the New Mexico Permian Basin with a Comprehensive Aerial Survey. Environ. Sci. Technol. 56, 4317 – 4323. https://doi.org/10.1021/acs.est.1c06458
Cusworth, D.H., Thorpe, A.K., Ayasse, A.K., Stepp, D., Heckler, J., Asner, G.P., Miller, C.E., Yadav, V., Chapman, J.W., Eastwood, M.L., Green, R.O., Hmiel, B., Lyon, D.R., Duren, R.M., 2022. Strong methane point sources contribute a disproportionate fraction of total emissions across multiple basins in the United States. Proceedings of the National Academy of Sciences 119, e2202338119. https://doi.org/10.1073/pnas.2202338119
El Abbadi, S.H., Chen, Z., Burdeau, P.M., Rutherford, J.S., Chen, Y., Zhang, Z., Sherwin, E.D., Brandt, A.R., 2024. Technological Maturity of Aircraft-Based Methane Sensing for Greenhouse Gas Mitigation. Environ. Sci. Technol. 58, 9591 – 9600. https://doi.org/10.1021/acs.est.4c02439
Fovell, R.G., Gallagher, A., 2022. An Evaluation of Surface Wind and Gust Forecasts from the High-Resolution Rapid Refresh Model. Weather and Forecasting 37, 1049 – 1068. https://doi.org/10.1175/WAF-D-21 – 0176.1
Fox, T.A., Gao, M., Barchyn, T.E., Jamin, Y.L. and Hugenholtz, C.H., 2021. An agent-based model for estimating emissions reduction equivalence among leak detection and repair programs. Journal of Cleaner Production, 282, p.125237. https://doi.org/10.1016/j.jclepro.2020.125237
GTI Energy, 2023a. Measurement Protocol, Production Segment (white paper), Version 1.0. https://veritas.gti.energy/protocols
GTI Energy, 2023b. Reconciliation Protocol, Production Segment (white paper), Version 1.0. https://veritas.gti.energy/protocols
GTI Energy, 2023c. Methane Emissions Intensity Protocol, All Segments (white paper), Version 1.0. https://veritas.gti.energy/protocols
Insight M, 2024. Insight M Methane Emissions Quantification Methodology (white paper). https://funky-lory.files.svdcdn.com/production/PDFs/Insight-M-Emissions-Quantification.pdf
Natural Gas Sustainability Initiative, February 2021, NGSI Methane Emissions Intensity Protocol, Version 1.0., https://www.eei.org/issues-and-policy/NGSI
Rutherford, J.S., Sherwin, E.D., Ravikumar, A.P., Heath, G.A., Englander, J., Cooley, D., Lyon, D., Omara, M., Langfitt, Q., Brandt, A.R., 2021. Closing the methane gap in US oil and natural gas production emissions inventories. Nat Commun 12, 4715. https://doi.org/10.1038/s41467-021 – 25017‑4
Sherwin, E. D., Chen, Y., Ravikumar, A. P., Brandt, A. R., 2021. Single-blind test of airplane-based hyperspectral methane detection via controlled releases. Elementa: Science of the Anthropocene, 9(1). https://doi.org/10.1525/elementa.2021.00063
Sherwin, E.D., Rutherford, J.S., Zhang, Z., Chen, Y., Wetherley., E., Yakovlev, P., Berman, E., Jones., B., Thorpe., A., Ayasse., A., Duren., R., Brandt., A., Cusworth., D, 2024, US oil and gas system emissions from nearly one million aerial site measurements. Nature 627, 328 – 334. https://doi.org/10.1038/s41586-024 – 07117‑5